PR Industry: Employment Up for Four Consecutive Years, But Still Below Pre-Recession Levels
Industry: Blog, In The News
(PRUnderground) January 31st, 2018
Key takeaways:
- Industry employment grows for four consecutive years, though jobs are still well below 2009 peak levels. Employment for the PR industry stood at 290,910 jobs in 2016, roughly 5,000 jobs lower compared to 2009.
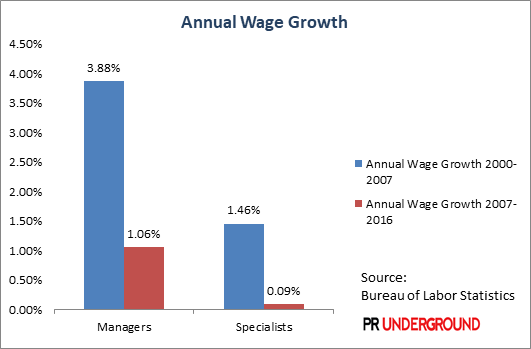
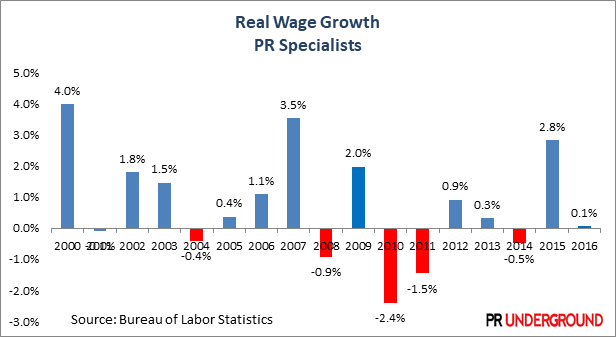
- Real wage growth almost non-existent for PR Specialist positions over the past 9 years. Annual real wage growth was on average 0.09%.
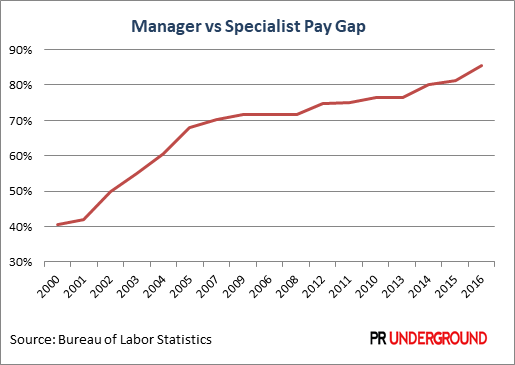
- Pay gap between PR Managers and PR Specialists widens and reaches an all-time high. PR Managers make on average $123,360/yr while PR Specialists $66,540/yr.
- Real wages for entry-level decreased over the past 8 years. PR Specialists from the two lowest income brackets (10% income percentile and 25% income percentile) have seen their wages grow by 6.5% respectively 10.6% compared to 2008 while inflation grew at a higher 10.9% during the same time period.
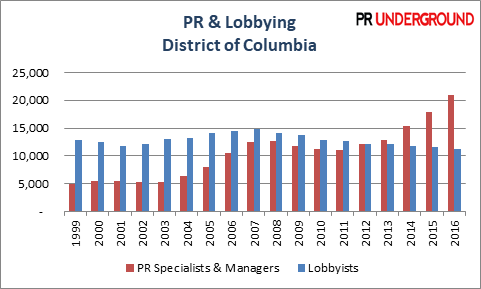
- PR Specialists are the new lobbyists? Explosive employment and wage grow in Washington DC can provide clues of this emerging trend. Back in 1999, there were more than twice as many lobbyists than PR professionals in Washington D.C., while the ratio has now inverted.
- San Francisco, San Jose, Washington D.C. and New York Metro area offer the highest wages for PR Specialist and PR Manager positions. However, when adjusted for the cost of living it’s Providence, RI, Detroit and Dallas among the places that offer the best remuneration.
Employment on the rise for four consecutive years, though still below the 2009 peak level.
The PRunderground.com study found that employment for PR Specialists and PR Managers has risen for four consecutive years, though the industry has still not regained all jobs lost after the financial crisis. With 290,910 professionals and managers employed in 2016, the industry is 5,000 jobs short from its peak employment level in 2009.
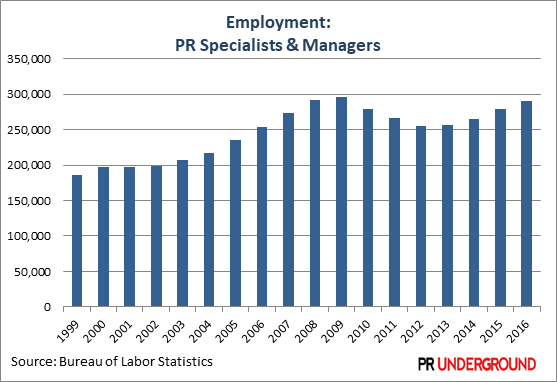
There were 11,620 new jobs added in 2016 which represents a very robust 4% Y-o-Y, though the pace of new jobs created in the industry was slower than the previous year when it grew at 5% Y-o-Y. Job creation was strong for both specialist and management-level positions, but historical employment trends for the groups are widely different.
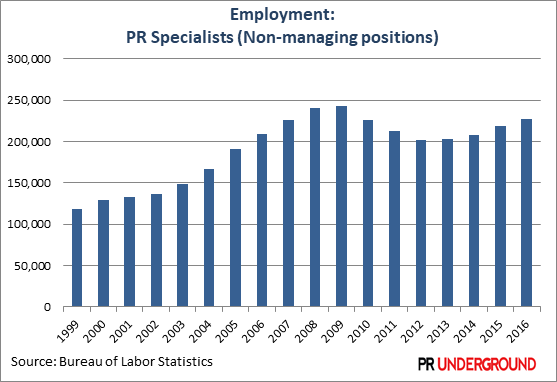
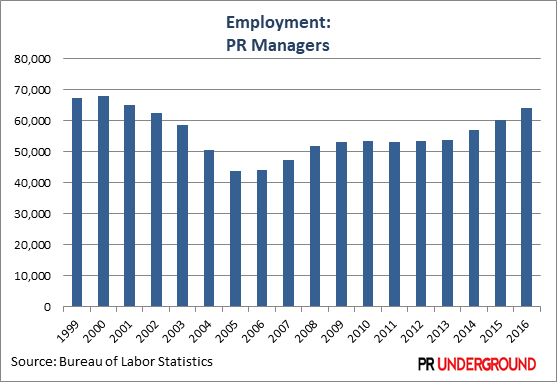
Employment for management-level positions in the industry has increased by a healthy 20% over the past 7 years, but current numbers are well below employment levels seen 16-17 years ago. PR Specialist positions, while still having some ground to gain from 2009 peak levels, have increased dramatically over the past 17 years, by close to 60%.
Almost zero real wage growth for PR Specialist positions for the past 9 years
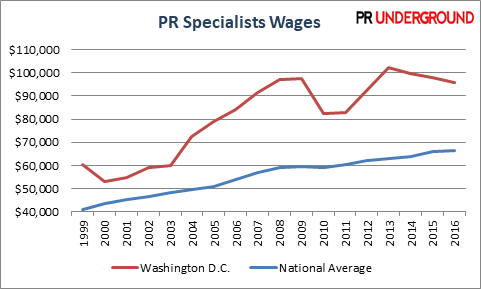
According to the latest figures published by the Bureau of Labor Statistics, PR Specialists are paid on average $66,540 per year or $32 per hour. For the past nine years, real wage growth (i.e. wage growth adjusted for inflation) has been almost non-existent for PR specialists. Starting 2008 through 2016 the annual real wage growth for non-managing positions in the PR industry was a dismal 0.09%. Moreover, for the four of the past 9 years, the real wage growth was negative.
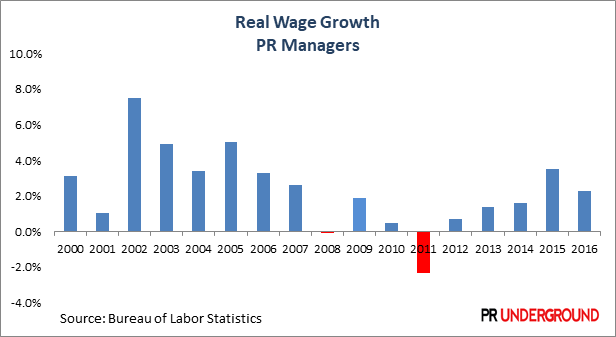
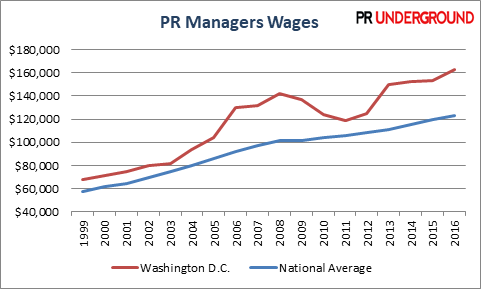
On the other hand, PR managers have continued to see a rise in real income after the financial crisis, albeit at a much lower rate than before. The latest official figures state that PR Managers earned $123,360 per year or $59 per hour. PR Managers salaries have increased at an annual rate of 1.06% after adjustment for inflation. Put differently real wage growth for management-level positions was 10.98% from 2016 compared to 2008.
The financial crisis impact on the industry has been profound. Not only has it brought a significant loss in employment, but also a halt in real wage appreciation. Prior to the financial crisis, between 2000 and 2007, the annual real wage appreciation was substantially higher for both managing and non-managing positions. For management-level positions annual real wage growth was 266% higher pre-crisis than post-crisis, while for non-managing positions annual real wage growth was a staggering 1522% higher.
Pay gap between management and non-management positions widens
In the early 2000s, PR Managers were paid roughly 40% higher than non-executive PR Specialists positions. Since then the pay gap between management and non-management positions has been on a relentless rise. The pay gap has doubled over the past 17 years, managers being currently paid on average 85% higher than their subordinates.
The pay gap continued to widen during the post-crisis years. While both groups saw their real wage growth halved compared to the pre-crisis levels, managers continued to see a steady appreciation in real incomes while real incomes for PR Specialists remained almost flat for 9 years.
This mirrors a global trend in the growing income gap between managers and subordinates, an issue that has received a lot of media attention over the past few years. According to a report released by global consulting firm Hay Group, a major cause for the growing disparity is that employers have given more responsibilities and more complex tasks to senior managers without increasing much their headcount. This has contributed to an increase in pay at the top end of the scale.
Entry-level jobs paid worse than 8 years ago
Entry-level positions, represented by jobs in the 10% and 25% income percentiles, have suffered disproportionally over the past few years. Those in the lowest income bracket – 10% income percentile – have seen their real incomes drop by a hefty 4.42%, while those in the 25% income percentile have seen a slight erosion of their real incomes compared to 2008.
The most junior PR Specialists (i.e. represented in the 10% income bracket) were making just $15.43 per hour or $32,090 per year in 2016. Since 2008, hourly pay increased by less than a dollar ($0.94) for this segment, while consumer goods price growth for the period was consistently higher at 10.89%. While in absolute terms, junior PR Specialists are earning more, they have a lower purchasing power than 8 years ago.
The erosion in real income is not seen for those in the higher income brackets nor for management level positions, which have seen real wage appreciation on all income percentiles. This is bad news for college graduates who are expected to get by through their first employment years with lower real incomes and surging college debt.
| PR Specialists Compensation 2016 vs 2008 | Wage Growth | CPI Inflation | Real Wage Growth |
| 10% Percentile | 6.47% | 10.89% | -4.42% |
| 25% Percentile | 10.55% | 10.89% | -0.35% |
| 50% Percentile | 13.14% | 10.89% | 2.25% |
| 75% Percentile | 11.13% | 10.89% | 0.24% |
| 90% Percentile | 12.92% | 10.89% | 2.03% |
| Overall | 12.86% | 10.89% | 1.96% |
Washington DC has the highest concentration of PR jobs and the most well paid ones.
State and metro level data shows a huge disparity in job creation and remuneration among PR professionals. Washington D.C., the nation’s capital, is without a doubt the forefront runner for the industry job creation. Compared to 1999, PR jobs have increased by an astounding 325% compared to ‘just’ 58% on a national level. Washington D.C. also leads the table for new job creation after the financial crisis with an increase of 65% from 2016 to 2008.
Proximity to D.C. has helped Maryland secure the second spot with a 257% increase in PR jobs, while Texas and Massachusetts secured the 3rd and 4th spot, both states more than doubling the numbers of PR professionals compared to 1999.
On the other end of the spectrum five states have lost jobs compared to 1999, with Wisconsin (-41%), Connecticut (-25%) and West Virginia (-18%) the states where PR pros have been hit the hardest.
Compared to 2008 the picture is less rosy with 28 states seeing negative job growth. West Virginia (-51%), Colorado (-47%) and Alabama (-44%) have lost the most jobs, while Washington D.C. (+65%), New Hampshire (+63%) and Oklahoma (+57%) have gained the most.
Is PR the New Lobbying?
In 2015, the Center of Public Integrity, a nonprofit news organization, released a report that showed that trade associations and other business groups have made a massive shift in the way they spend their lobbying budgets. The bulk of these budgets now go to PR and Marketing agencies and less so towards traditional lobbying firms.
Our study seems to support their findings. Washington D.C. has added an astounding number of PR jobs over the past 17 years. Employment in PR has increased by 325% since 1999, 5 times higher than the national average. Out of the top 10 largest PR companies in the world, 9 have offices in the city, and almost all have public affairs divisions that make specific references to Capitol Hill on their websites. On the other hand, the number of federal lobbyists has seen a downward trend, according to data from the Center for Responsive Politics (the vast majority of federal lobbyist are based in Washington D.C.). Back in 1999, there were more than twice as many lobbyists than PR professionals in Washington D.C., while the ratio has now inverted.
Wage data could also provide a further piece of evidence. Wages for PR Specialists and Managers in Washington D.C. are gravitating more and more in the direction of high-paying lobbyist earnings.
PR wages in Washington D.C. have increased much faster than the national industry average. Moreover, local PR industry wages, especially for management-level positions, have surpassed other well-paid industries such as Finance and IT. In 1999, PR Managers were paid significantly lower than Financial Managers, Computer and IT Managers, or General and Operations Managers. Fast-forward to 2016, and PR Managers have made it into the top 10 of the highest-paying professions in Washington D.C., earning more than their Finance and IT counterparts.
Whether this new trend is here to stay, the blurring line between PR and lobbying is getting increased attention so much so that some are requesting for PR to be regulated as an integrated part of lobby industry.
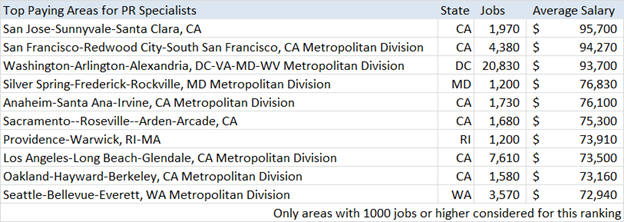
Top areas with the highest wages for PR Specialists
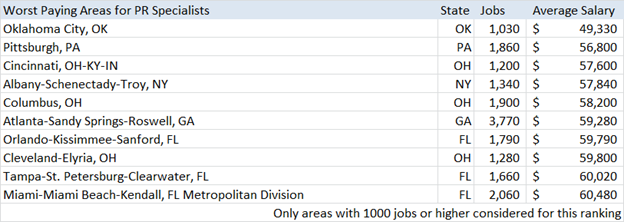
If you’re working in PR, California and the Washington D.C metro are your best bet for securing a great paying job. The Golden State far outranks any other state with 6 areas in the top 10 ranking, including the top two. PR pros from the top three regions, San Francisco, San Jose and Washington D.C. are expected to earn 40% more than the national average and almost double compared to their peers in Oklahoma City and Pittsburgh. Even more, PR Specialists from these areas are remunerated higher than the average management-level positions from Oklahoma City or Memphis.
Top Paying Areas When Adjusted for Living Expenses (PR Specialists)
The rankings for the top paying areas for PR Specialists change significantly when wages are compared to the living wage for their respective areas. PR Specialists from Providence, RI earn the highest wages relative to the living wage in the region, followed by their peers in Sacramento, CA and surprisingly Detroit, MI. Texas is also well represented in the table with three of the top 10 areas due to the relative high income and low cost of living.
In spite of a very high cost of living, PR Specialists from Silicon Valley are just too well paid to miss the top 10 table and enjoy a very respectable 6th place.
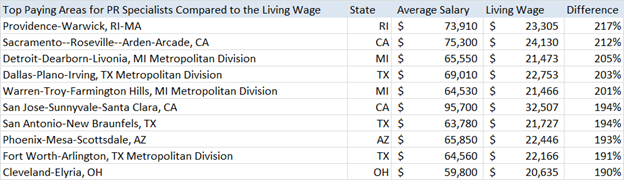
Data for living wages was sourced using MIT’s Living Wage Calculator and represents the living wage for one adult in their respective regions. Living wages represent an approximate income amount needed to meet an individual’s basic needs such as housing, transportation, food expenses and health care.
Worst Paying Areas When Adjusted for Living Expenses (PR Specialists)
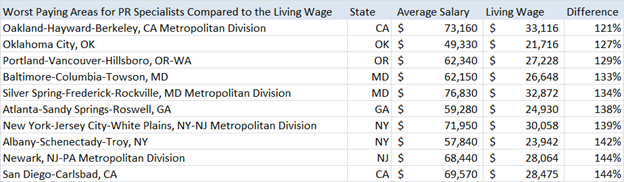
Multiple areas from high-income states such as California, New York and New Jersey do much worse when wages are adjusted for their notoriously high living costs. PR Specialists in Oakland, New York or San Diego are paid among the worst when their income is compared to the living wage in their respective regions.
However, one of the worst places to be employed as a PR Specialist seems to be Oklahoma City. The area is the worst-paying in terms absolute wages and only second to Oakland for the lowest income compared to the local living wage.
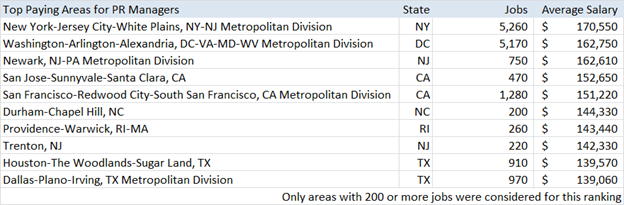
Top areas with the highest wages for PR Managers
With the highest number of corporate headquarters, the NY Metro secures two of the top three areas with the best paid PR Managers. Washington D.C. comes second and it’s only fair to say that D.C. may be one of the best places in the US for working in PR, enjoying an astounding growth in employment and offering top paying jobs for both management and non-management positions.
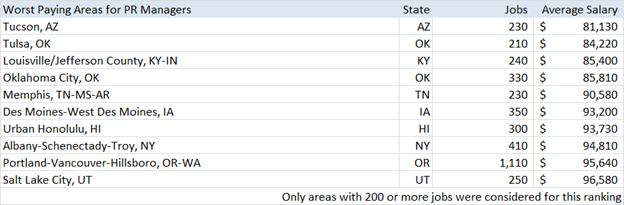
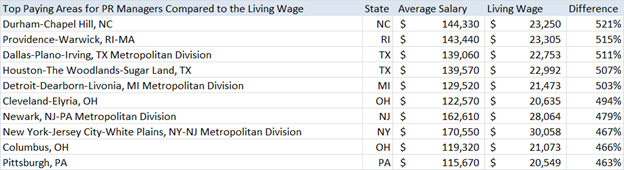
Top Paying Areas When Adjusted for Living Expenses (PR Managers)
When adjusted for living expenses, it is PR Managers in Durham-Chapel Hill, NC, and again Providence Rhode Island that earn the highest income compared to the local living wage. Dallas and Houston of Texas come in 3rd and 4th and Detroit makes another appearance it in the top 5 of the top-paying areas for PR professionals.
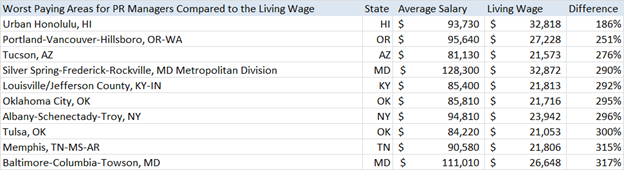
Urban Honolulu makes an unforeseen appearance as the area with the lowest income when compared to the cost of living. Hawaii is one of the wealthiest states in the country, with the median household income substantially above the national average. However, it is also very expensive to live there and it looks like PR Managers are not remunerated well enough to make up for the high living expenses.
Methodology
The study is based off of employment and wage data published by the Bureau of Labor Statistics in the month of May going back 17 years. Inflation data was sourced from the Federal Reserve Bank of St. Louis website. Annual inflation rates were calculated for the month of May to be accordant to the wage and employment data published for the same month.
Living wages were sourced from MIT’s Living Wage Calculator page. For some areas where we found no direct correspondent, we’ve used the living wage for the closest matching area (e.g. for the Anaheim-Santa-Ana-Irvine Metropolitan Division we have used the living wage for Orange County, CA). The number of federal lobbyist was sourced from the Center of Responsive Politics (the vast majority of federal lobbyist are based in Washington D.C.).